
I am Ashley, and if you are anything like me, the grocery bill has taken a real bite out of your month. I find a certain amount of comfort in data, so rather than just being annoyed about it I went and looked at what has actually happened to food prices over the last few years.
The short version is worse than I expected, and not in the way I expected.
Prices did not spike and come back. They stepped up and stayed.
This is the part I think gets lost in the way inflation is reported.
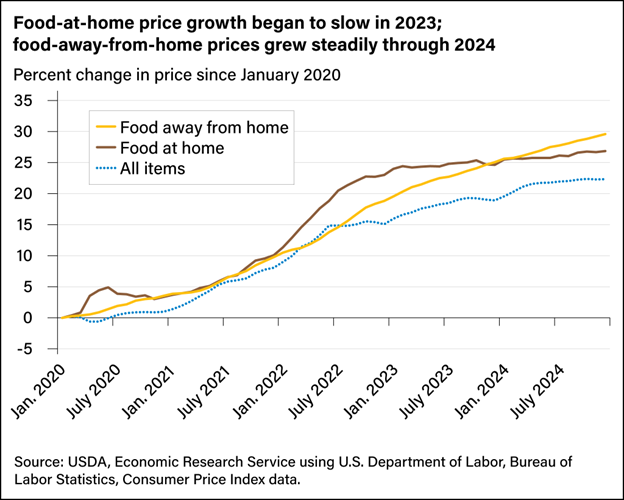
Between January 2020 and January 2023, food prices rose about 24%. That number gets quoted a lot. What gets quoted less is what happened next, which is: nothing. Prices did not come back down. The rate of increase slowed, which is what "inflation is cooling" means, and people hear that as "prices are going back to normal."
They are not. A slowing rate of increase is still an increase. Cooling inflation means the bill is going up more slowly from a level that is already about a quarter higher than it was.
I think this is the single biggest gap between how food inflation is reported and how it is experienced. The news covers the derivative. You live in the number itself.
What the recent data says
According to the USDA's Food Price Outlook, food prices have been rising faster than overall inflation. Food prices were about 3.2% higher in August 2025 than a year earlier. Beef and veal soared by 13.9% over the same period. Egg prices jumped 8.5% nationally in 2024 before the far more dramatic run that followed.
Put that against a raise. If you received a 3% annual raise, and food ran at 3.2%, your purchasing power on groceries went slightly backwards in a year that felt, on paper, like a year you got ahead. If your household eats a lot of beef, it went backwards considerably.
That gap between "I got a raise" and "I have less money" is one of the more demoralising things about this stretch, and it is arithmetic rather than imagination.
Why averages hide what happened to you
A national food inflation figure is a weighted average across an enormous basket. Nobody buys the average basket. You buy about forty things, over and over, and the inflation rate of those forty things is your rate.
Look at the numbers above again. Overall food, 3.2%. Beef and veal, 13.9%. Those are in the same report, in the same period. A household that eats beef three nights a week had a completely different year from one that eats beans three nights a week, and the single headline figure contains both of them without describing either.
This is why the reaction to every inflation report is people saying "that is not what my receipt says." Often they are right. The statistic is a description of a country, not a forecast for a kitchen.
The three things that actually drove it
It is worth knowing what caused this, because the causes have different timelines and some of them unwind and some do not.
Supply chain
The 2020–2022 portion was largely disruption: freight, labour, packaging, fuel. Most of that has substantially normalised. This is the part of the 24% that was genuinely temporary in its cause, though not in its effect, because prices are famously easier to raise than to lower.
Animal disease and herd cycles
The beef number is not a supply chain story. The US cattle herd has been at multi-decade lows, and rebuilding one is slow in a way that has nothing to do with policy or logistics. A rancher who decides today to expand is looking at years before that shows up as beef. Avian influenza does the same thing to eggs on a compressed timescale.
These are biological constraints. They resolve, but on their own schedule, and no amount of attention makes them go faster.
Everything downstream of energy
Fertiliser, freight, refrigeration, processing. Food is an energy-intensive business and energy costs propagate into it with a lag long enough that people have usually stopped connecting the two by the time the price moves.
The part you can actually control
Here is where I have landed after a couple of years of paying close attention.
You cannot control inflation. You can control where you shop and what you are loyal to, and between those two the first one is much larger than most people assume.
The gap between two stores in the same city, on the same week, on the same product, is routinely larger than a year of food inflation. Not a little larger. Multiples larger. Inflation is the number in the news because it happens to everybody at once and is nobody's fault. Store choice is the bigger number that never gets discussed because it is a decision you already made and quietly repeat every week.
Why per unit is the only honest comparison
This is the thing Smopper exists to do, and it is worth explaining with an actual example rather than a claim.
Store A sells an 11.5-ounce box of cereal for $4.79. Store B sells the same brand in a 35-ounce bag for $6.99.
Store A has the lower price. Store B has the lower cost. Per ounce, Store A is $0.42 and Store B is $0.20, which means the bag is less than half as expensive per bowl of cereal, and the shelf price tells you the opposite.
That is not a trick question. That is a normal Tuesday in a normal aisle, and the reason it works is that the number printed largest is the one that answers a question you do not have. I have written about how far that problem goes. The same shelf can price two products in two different units, and our own database holds butter measured eleven different ways.
What I would actually do about it
Three things, in the order I would do them.
Find out what your store costs you. Not in the abstract. Take the ten things you buy every week and price them per unit at two stores you could plausibly shop. That number, whatever it turns out to be, is the largest lever you have, and it is a one-time exercise rather than an ongoing discipline. Our own comparison of the Pittsburgh chains found gaps well into the double digits on staple categories.
Audit what you are loyal to, once a year. Most of a grocery bill is not a set of decisions. It is one old decision repeated four hundred times. When I actually tested twelve of mine, nine of the switches stuck and I have not thought about them since.
Learn two numbers per category and stop doing math in aisles. A good price and a stock-up price, per pound or per ounce, for the ten things you actually buy. After a month you stop calculating and start noticing, which is a much lower-effort state to live in.
The honest summary
Food is about a quarter more expensive than it was before the pandemic and it is not going back. The rate has slowed, which is genuinely good news and is not at all the same news as prices falling.
Against that, the things within reach are unglamorous: know what your store costs you, check whether your habits still deserve you, and read the small number on the shelf tag instead of the big one. None of that is a strategy so much as paying attention in the two or three places where paying attention is worth actual money.
I built Smopper because I was tired of missing that and overpaying without ever quite knowing by how much. If you want to see what your own list looks like across the stores near you, that is what it is for.